Chapter 6 Adventures in covariance
library(ggplot2)
library(modelr)
library(purrr)
library(rethinking)
## Loading required package: rstan## Loading required package: StanHeaders## rstan (Version 2.16.2, packaged: 2017-07-03 09:24:58 UTC, GitRev: 2e1f913d3ca3)## For execution on a local, multicore CPU with excess RAM we recommend calling
## rstan_options(auto_write = TRUE)
## options(mc.cores = parallel::detectCores())## Loading required package: parallel## Loading required package: methods## rethinking (Version 1.59)##
## Attaching package: 'rethinking'## The following object is masked from 'package:purrr':
##
## map## The following object is masked from 'package:modelr':
##
## resamplelibrary(rstan)
library(tidyverse)## Loading tidyverse: tibble
## Loading tidyverse: tidyr
## Loading tidyverse: readr
## Loading tidyverse: dplyr## Conflicts with tidy packages ----------------------------------------------## extract(): tidyr, rstan
## filter(): dplyr, stats
## lag(): dplyr, stats
## map(): purrr, rethinking
## resample(): modelr, rethinkingknitr::opts_chunk$set(echo = TRUE, cache = TRUE)
map <- purrr::map
select <- dplyr::select
## simulate the population
a <- 3.5 # average morning wait
b <- -1 # average difference afternoon wait time
sigma_a <- 1 # std dev in intercepts
sigma_b <- 0.5 # std dev in slopes
rho <- -0.7 # correlation between intercepts and slopes## modelling covariance in this population
Mu <- c(a, b)
cov_ab <- sigma_a * sigma_b * rho
Sigma <- matrix(c(sigma_a ^ 2, cov_ab, cov_ab, sigma_b ^ 2), ncol = 2)
## or alternatively
sigmas <- c(sigma_a, sigma_b)
Rho <- matrix(c(1, rho, rho, 1), ncol = 2)
Sigma <- diag(sigmas) %*% Rho %*% diag(sigmas)simulate cafes:
N_cafes <- 20

set.seed(5)

vary_effects <- MASS::mvrnorm(N_cafes, Mu, Sigma)

vary_effects_df <- vary_effects %>%
  as.data.frame() %>%
  set_names(c("a_cafe", "b_cafe")) %>%
  rownames_to_column("cafe_id")

vary_effects_df %>%
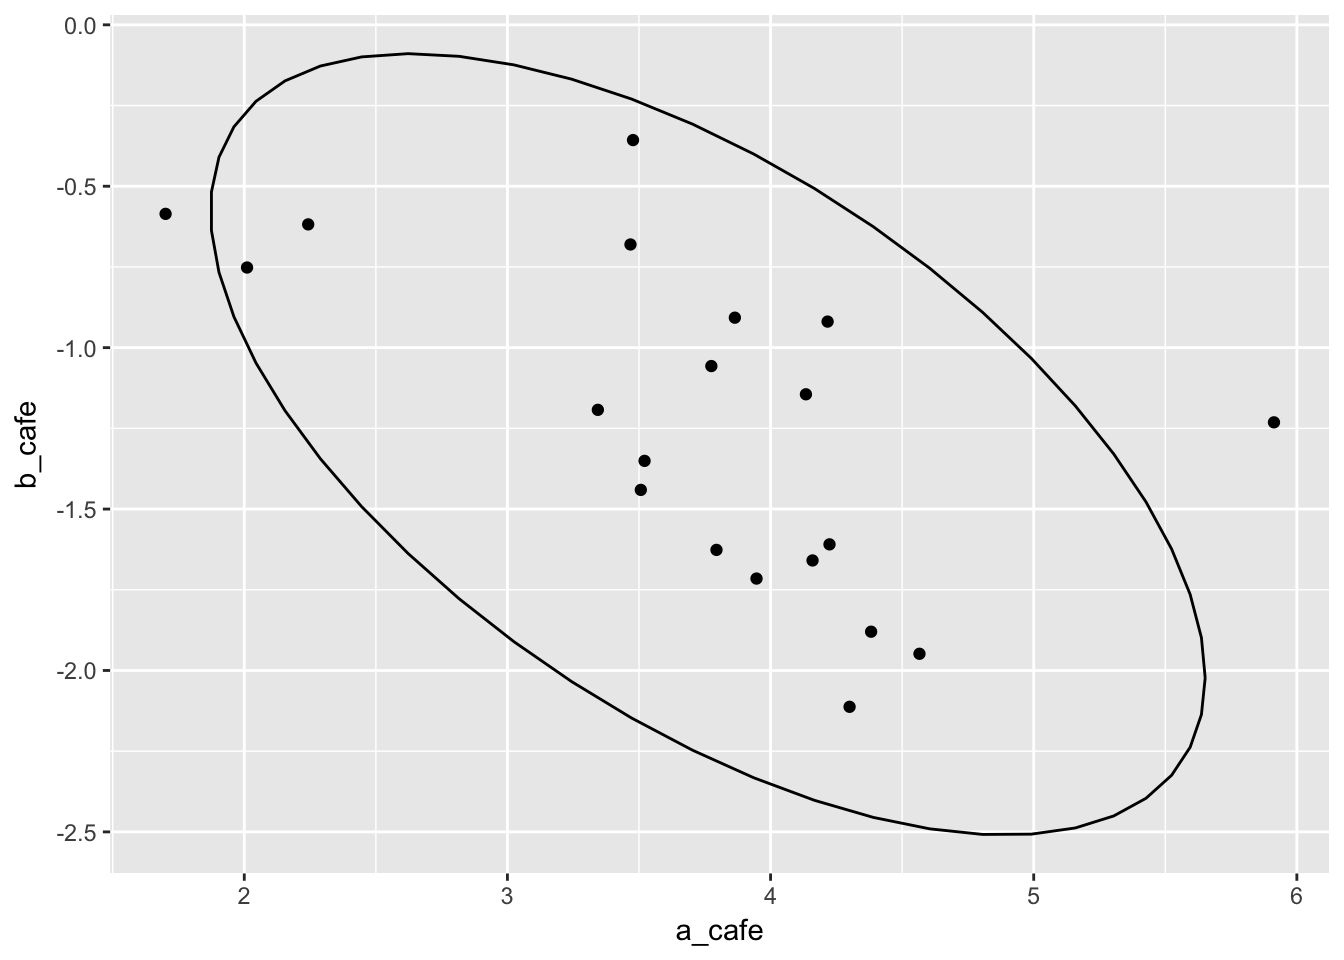
  ggplot(aes(x = a_cafe, y = b_cafe)) + geom_point() + stat_ellipse()
Now simulate wait times at these cafes:
n_visits <- 10

true_values <- expand.grid(cafe_id = seq_len(N_cafes), afternoon = 0:1) %>%
  replicate(5, ., simplify = FALSE) %>%
  bind_rows(.id = "visit") %>%
  mutate(cafe_id = as.character(cafe_id)) %>%
  left_join(vary_effects_df)
## Joining, by = "cafe_id"wait_times <- true_values %>%
mutate(mu = a_cafe + b_cafe * afternoon,
wait = rnorm(length(mu), mu, sd = 0.5))
wait_times %>% glimpse %>%
dplyr::select(visit, cafe_id, wait, afternoon) %>%
spread(afternoon, wait) %>%
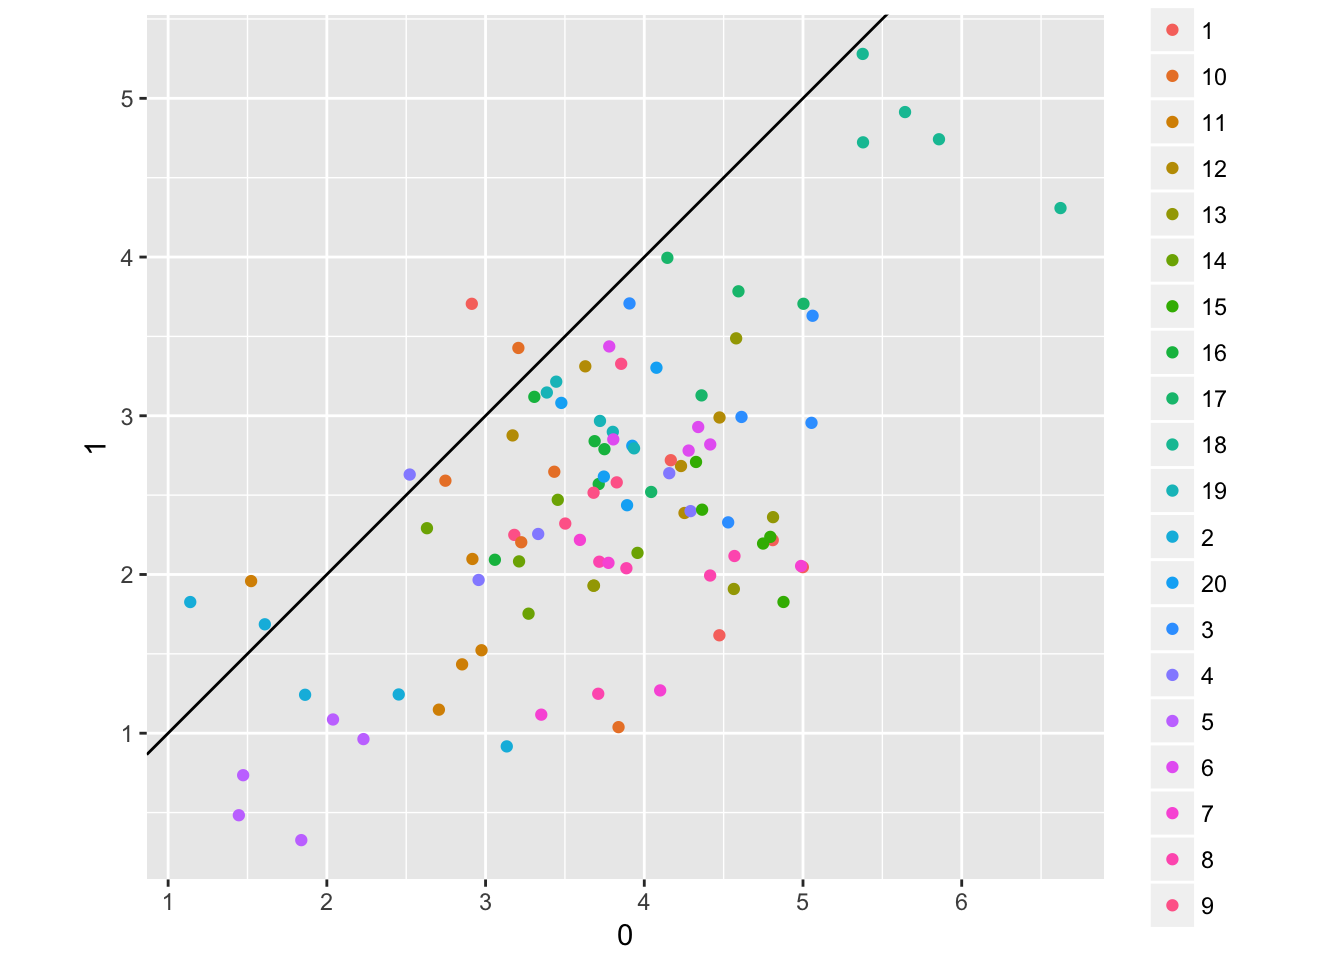
ggplot(aes(x = `0`, y = `1`, colour = cafe_id)) + geom_point() + coord_fixed() + geom_abline(intercept = 0, slope = 1)## Observations: 200
## Variables: 7
## $ visit <chr> "1", "1", "1", "1", "1", "1", "1", "1", "1", "1", "1...
## $ cafe_id <chr> "1", "2", "3", "4", "5", "6", "7", "8", "9", "10", "...
## $ afternoon <int> 0, 0, 0, 0, 0, 0, 0, 0, 0, 0, 0, 0, 0, 0, 0, 0, 0, 0...
## $ a_cafe <dbl> 4.223962, 2.010498, 4.565811, 3.343635, 1.700971, 4....
## $ b_cafe <dbl> -1.6093565, -0.7517704, -1.9482646, -1.1926539, -0.5...
## $ mu <dbl> 4.223962, 2.010498, 4.565811, 3.343635, 1.700971, 4....
## $ wait <dbl> 4.9989926, 1.6092864, 4.5285215, 4.2914693, 1.472686...
wait_times %>% glimpse %>%
  dplyr::select(visit, cafe_id, wait, afternoon) %>%
  mutate(afternoon = as.factor(afternoon)) %>%
  group_by(cafe_id) %>%
  mutate(mean_cafe = mean(wait)) %>%
  ungroup %>%
  mutate(low_wait = cut(mean_cafe, 2)) %>%
  ggplot(aes(x = afternoon, y = wait, colour = cafe_id)) +
  geom_point() + geom_line(aes(x=as.numeric(afternoon))) +
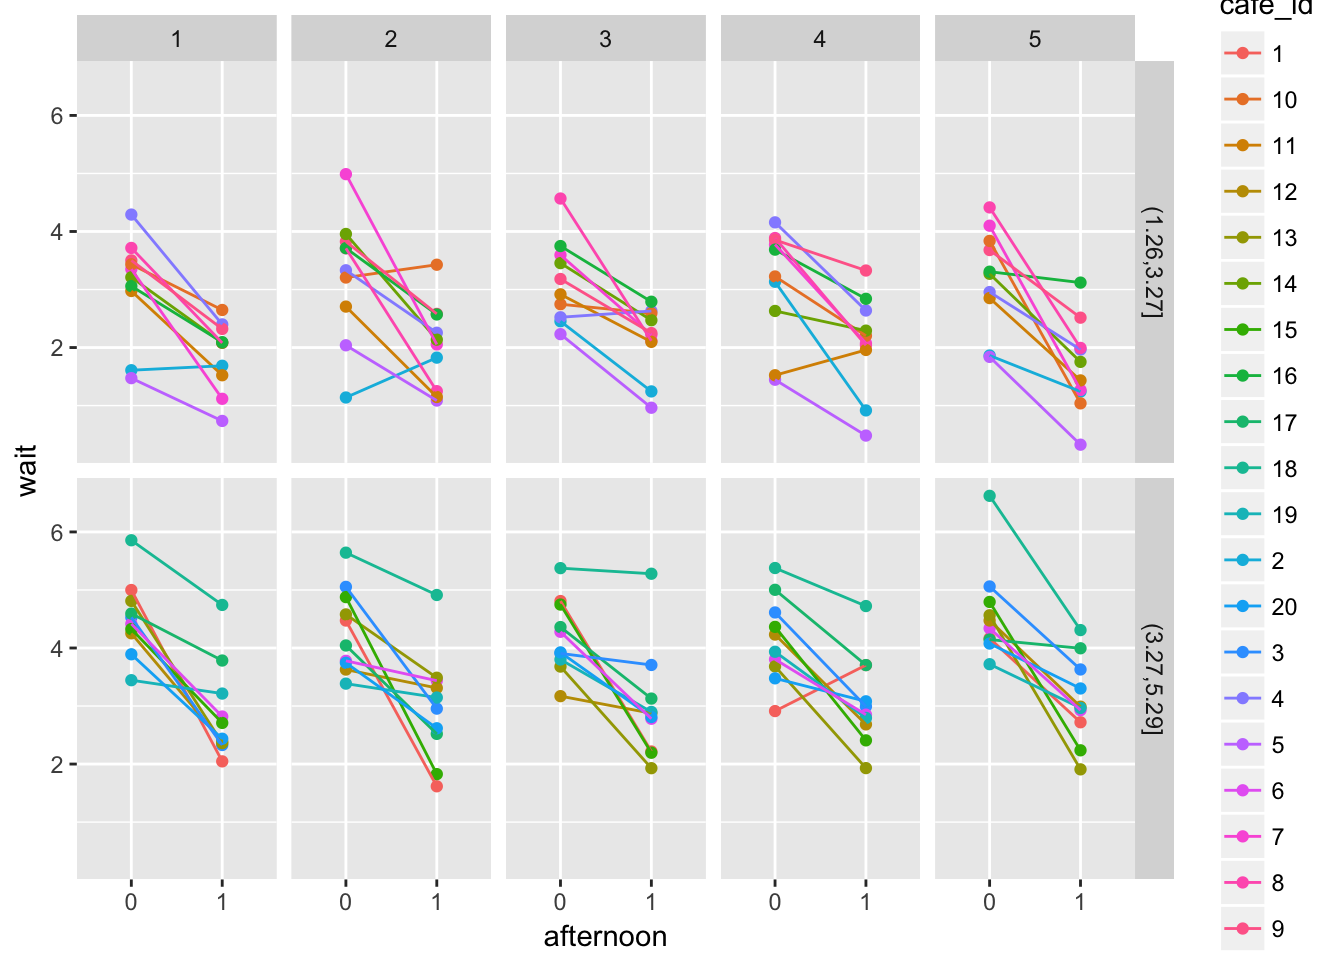
  facet_grid(low_wait~visit)
## Observations: 200
## Variables: 7
## $ visit <chr> "1", "1", "1", "1", "1", "1", "1", "1", "1", "1", "1...
## $ cafe_id <chr> "1", "2", "3", "4", "5", "6", "7", "8", "9", "10", "...
## $ afternoon <int> 0, 0, 0, 0, 0, 0, 0, 0, 0, 0, 0, 0, 0, 0, 0, 0, 0, 0...
## $ a_cafe <dbl> 4.223962, 2.010498, 4.565811, 3.343635, 1.700971, 4....
## $ b_cafe <dbl> -1.6093565, -0.7517704, -1.9482646, -1.1926539, -0.5...
## $ mu <dbl> 4.223962, 2.010498, 4.565811, 3.343635, 1.700971, 4....
## $ wait <dbl> 4.9989926, 1.6092864, 4.5285215, 4.2914693, 1.472686...
6.0.1 prelude to building a varying slopes model
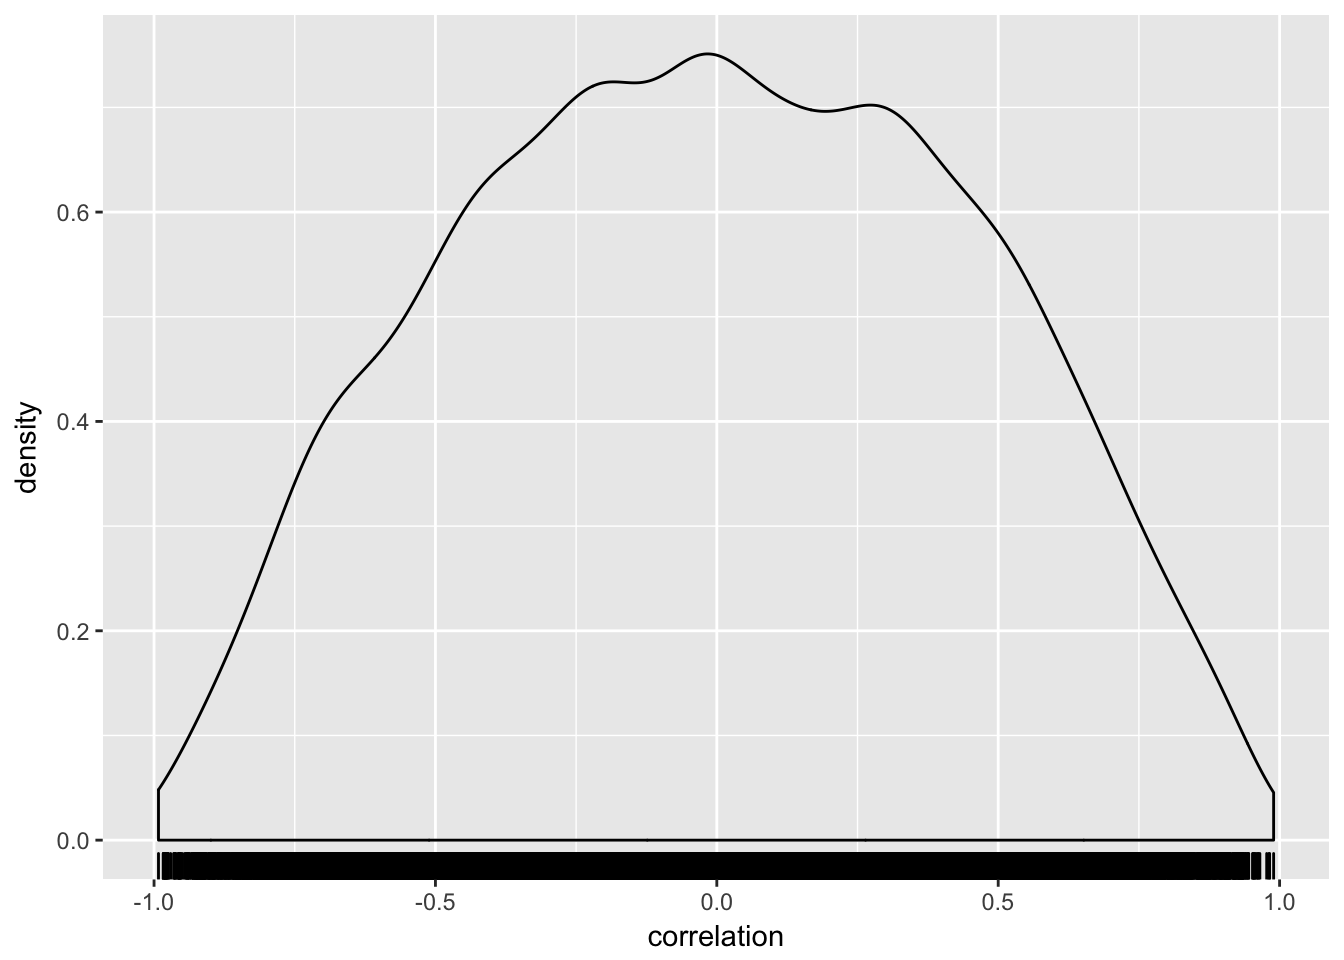
plot the prior for the correlation matrix (a necessary ingredient in simulating a multivariate normal distribution)
R <- rethinking::rlkjcorr(1e4, K = 2, eta = 2)

R[2,,]
## [,1] [,2]
## [1,] 1.00000000 -0.06623585
## [2,] -0.06623585 1.00000000R[7,,]## [,1] [,2]
## [1,] 1.000000 0.256484
## [2,] 0.256484 1.000000## it is a three dimensional matrix. To show the distribution of the "upper right corner" of each correlation matrix:
R[,1,2] %>%
data_frame(correlation = .) %>%
ggplot(aes(x = correlation)) + geom_density() + geom_rug()
claculate the model:
library(rethinking)
m13.1 <- rethinking::map2stan(
  alist(
    wait                     ~ dnorm(mu_wait, sigma),
    mu_wait                  <- a_cafe[cafe_id] +
                                b_cafe[cafe_id] * afternoon,
    c(a_cafe, b_cafe)[cafe_id] ~ dmvnorm2(c(a, b), sigma_cafe, Rho),
    a ~ dnorm(0, 10),
    b ~ dnorm(0, 10),
    sigma_cafe ~ dcauchy(0, 2),
    sigma ~ dcauchy(0,2),
    Rho ~ dlkjcorr(2)
  ),
  data = as.data.frame(wait_times),
  iter = 5000, warmup = 2000, chains = 2
)

saveRDS(m13.1, "stan_models/m13_1.rds")m13.1 <- readRDS("stan_models/m13_1.rds")
precis(m13.1 )## 46 vector or matrix parameters omitted in display. Use depth=2 to show them.## Mean StdDev lower 0.89 upper 0.89 n_eff Rhat
## a 3.76 0.22 3.42 4.10 6000 1
## b -1.28 0.12 -1.48 -1.08 6000 1
## sigma 0.49 0.03 0.45 0.54 6000 1Let’s visualize the posterior
post <- rethinking::extract.samples(m13.1)

## specifically the posterior of the correlation
purrr::map(1:3, ~ post$Rho[.x,,])
## [[1]]
## [,1] [,2]
## [1,] 1.0000000 -0.5314062
## [2,] -0.5314062 1.0000000
##
## [[2]]
## [,1] [,2]
## [1,] 1.00000000 -0.03992444
## [2,] -0.03992444 1.00000000
##
## [[3]]
## [,1] [,2]
## [1,] 1.0000000 -0.4700808
## [2,] -0.4700808 1.0000000post$Rho[,1,2] %>%
data_frame(posterior = .) %>%
mutate(prior = purrr::map(posterior, ~rlkjcorr(1, K = 2, eta = 2)),
prior = map_dbl(prior, ~ .x[1,2])) %>%
gather(distrib, value) %>%
ggplot(aes(x = value, lty = distrib))+
geom_density(adjust = 0.3)
That is the correlation between slope and intercept. but what about the actual predictions?
## compare to fitting separate slopes

## compare to averaging

## calculate true a and b, as the mean for each individual cafe
obs_differnces <- wait_times %>%
  group_by(cafe_id, afternoon) %>%
  nest %>%
  mutate(mean_wait = map_dbl(data, ~ .x$wait %>% mean)) %>%
  dplyr::select(-`data`) %>%
  spread(afternoon, mean_wait) %>%
  mutate(a1 = `0`,
         b1 = `1` - `0`)

with(obs_differnces,
     plot(a1, b1,
          xlab = "Intercept", ylab = "slope",
          ylim = c(min(b1) - 0.1, max(b1) + 0.1),
          xlim = c(min(a1) - 0.1, max(a1) + 0.1),
          pch = 21, bg = "forestgreen"))

obs_differnces$a2 <- colMeans(post$a_cafe)
obs_differnces$b2 <- colMeans(post$b_cafe)

with(obs_differnces,
     points(a2, b2))

make_lines <- function(a1, a2, b1, b2){
  lines(c(a1, a2), c(b1, b2))
}

obs_differnces %>%
  dplyr::select(a1, a2, b1, b2) %>%
  pwalk(lift_dl(make_lines))
6.1 Admissions
library(rethinking)
data("UCBadmit")
d <- UCBadmit %>%
  mutate(male = if_else(applicant.gender == "male", 1, 0),
         dept_id = coerce_index(dept))
## set the model
ucb_varying_inter <- alist(
admit ~ dbinom(applications, p),
logit(p) <- a_dept[dept_id] + bm * male,
a_dept[dept_id] ~ dnorm(a, sigma_dept),
a ~ dnorm(0, 10),
bm ~ dnorm(0, 1),
sigma_dept ~ dcauchy(0, 2)
)m13.2 <- rethinking::map2stan(
ucb_varying_inter,
data = d, warmup = 500, iter = 4500, chains = 3
)
saveRDS(m13.2, "stan_models/m13_2.rds")m13.2 <- readRDS("stan_models/m13_2.rds")
precis(m13.2, depth = 2)## Mean StdDev lower 0.89 upper 0.89 n_eff Rhat
## a_dept[1] 0.67 0.10 0.51 0.82 7366 1
## a_dept[2] 0.63 0.12 0.44 0.80 7995 1
## a_dept[3] -0.58 0.07 -0.71 -0.47 12000 1
## a_dept[4] -0.62 0.09 -0.75 -0.47 12000 1
## a_dept[5] -1.06 0.10 -1.22 -0.90 12000 1
## a_dept[6] -2.61 0.16 -2.85 -2.35 12000 1
## a -0.58 0.66 -1.58 0.40 8743 1
## bm -0.09 0.08 -0.22 0.04 6403 1
## sigma_dept 1.48 0.59 0.71 2.17 7218 1stancode(m13.2)## data{
## int<lower=1> N;
## int<lower=1> N_dept_id;
## int admit[N];
## int applications[N];
## real male[N];
## int dept_id[N];
## }
## parameters{
## vector[N_dept_id] a_dept;
## real a;
## real bm;
## real<lower=0> sigma_dept;
## }
## model{
## vector[N] p;
## sigma_dept ~ cauchy( 0 , 2 );
## bm ~ normal( 0 , 1 );
## a ~ normal( 0 , 10 );
## a_dept ~ normal( a , sigma_dept );
## for ( i in 1:N ) {
## p[i] = a_dept[dept_id[i]] + bm * male[i];
## }
## admit ~ binomial_logit( applications , p );
## }
## generated quantities{
## vector[N] p;
## real dev;
## dev = 0;
## for ( i in 1:N ) {
## p[i] = a_dept[dept_id[i]] + bm * male[i];
## }
## dev = dev + (-2)*binomial_logit_lpmf( admit | applications , p );
## }6.2 Continuous categories and the Gaussian process
In this section, the goal is to learn how to allow slopes to vary over a continuous gradient. This involves specifying a sensible covariance matrix for a multivariate normal distribution.
# start by loading the distance matrix
data("islandsDistMatrix")

Dmat <- islandsDistMatrix
colnames(Dmat) <- substr(colnames(Dmat), 1,4)
Dmat
## Male Tiko Sant Yap Lau Trob Chuu Manu Tong Hawa
## Malekula 0.000 0.475 0.631 4.363 1.234 2.036 3.178 2.794 1.860 5.678
## Tikopia 0.475 0.000 0.315 4.173 1.236 2.007 2.877 2.670 1.965 5.283
## Santa Cruz 0.631 0.315 0.000 3.859 1.550 1.708 2.588 2.356 2.279 5.401
## Yap 4.363 4.173 3.859 0.000 5.391 2.462 1.555 1.616 6.136 7.178
## Lau Fiji 1.234 1.236 1.550 5.391 0.000 3.219 4.027 3.906 0.763 4.884
## Trobriand 2.036 2.007 1.708 2.462 3.219 0.000 1.801 0.850 3.893 6.653
## Chuuk 3.178 2.877 2.588 1.555 4.027 1.801 0.000 1.213 4.789 5.787
## Manus 2.794 2.670 2.356 1.616 3.906 0.850 1.213 0.000 4.622 6.722
## Tonga 1.860 1.965 2.279 6.136 0.763 3.893 4.789 4.622 0.000 5.037
## Hawaii 5.678 5.283 5.401 7.178 4.884 6.653 5.787 6.722 5.037 0.000Before we fit to actual data, loot at the multivariate prior for the intercepts:
curve(exp(-1*x), from = 0, to = 4, lty = 2)

curve(exp(-1 * x ^ 2), add = TRUE)
So squaring the decline gives it a slightly curvy shape, which is definitely appealing.
It might be fun to look at different values of p2 in there, just to see. In the examples above it is 1.
Fit the model
data("Kline")

d <- Kline

d$society <- 1:10

d$logpop <- log(d$population)library(rethinking)
m13.7 <- alist(
total_tools ~ dpois(lambda),
log(lambda) <- a + g[society] + bp * logpop,
g[society] ~ GPL2(Dmat, etasq, rhosq, 0.01),
a ~ dnorm(0, 10),
bp ~ dnorm(0, 1),
etasq ~ dcauchy(0,1),
rhosq ~ dcauchy(0,1)
)m13.7 <- rethinking::map2stan(
m13.7,
data = list(
total_tools = d$total_tools,
logpop = d$logpop,
society = d$society,
Dmat = islandsDistMatrix
), warmup = 2000, iter = 1e4, chains = 4)# checking chains?
m13.7_post <- extract.samples(m13.7)
m13.7_post %>% str()
m13.7_post$a %>% plot(type = "l")